This interactive web page developed by Allianz is a great resource summarising some of the census and other data sources on cycling.
Good on you Allianz for doing your bit to provide information and promote cycling.
It would be great if all cities and states provided this sort of update on an annual basis. It provides a fantastic barometer on how we are doing in supporting active transport.
Portland, Oregon regularly publishes a short report on cycling in the city on key corridors. It provides a great snap shot of cycling trends in the city. The National Cycling Participation Survey is great, but the information could be presented in a far more accessible format than a PDF report.
Showing posts with label data. Show all posts
Thursday, March 9, 2017
Tuesday, January 28, 2014
Crash data available on line
Government's open data policy is making access to crash data far easier. Have a look at the website to see what else is or will soon be available from the Department of Transport and other government agencies. I played with the crash data and was quite horrified to see the carnage that occurs on our road network.
There is lots of data on crashes involving pedestrians and cyclists and any number of different ways to cut it. Here is a graph I put together summarising the fatalities and hospitalisations of cyclists over the last 10 years split by TMR regions.
As you would expect, the Metropolitan Region has the highest number of fatalities and hospitalisations. What would be interesting to cross-correlate this data with population and/or cycling activity levels.
The data from TMR includes the traffic census on state controlled roads for 2012 but unfortunately does not include the count data for bicycles that TMR previously placed on the 131940 web site. It would be great if the historical count data from their cycle monitoring stations could also be released as it was previously.
There is lots of data on crashes involving pedestrians and cyclists and any number of different ways to cut it. Here is a graph I put together summarising the fatalities and hospitalisations of cyclists over the last 10 years split by TMR regions.
As you would expect, the Metropolitan Region has the highest number of fatalities and hospitalisations. What would be interesting to cross-correlate this data with population and/or cycling activity levels.
The data from TMR includes the traffic census on state controlled roads for 2012 but unfortunately does not include the count data for bicycles that TMR previously placed on the 131940 web site. It would be great if the historical count data from their cycle monitoring stations could also be released as it was previously.
Wednesday, March 14, 2012
Cities Fit for Cycling
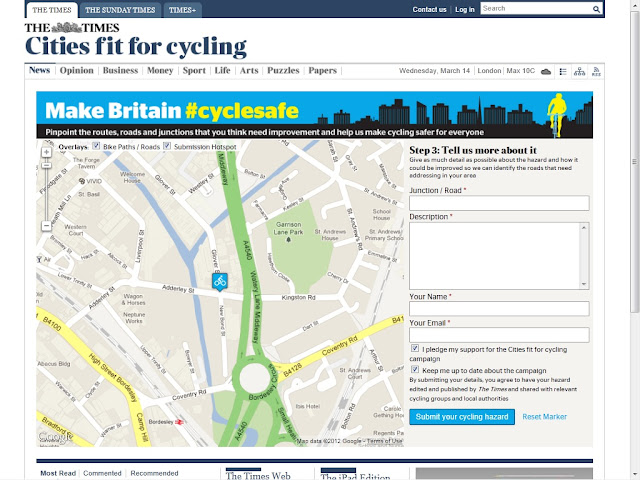
The Times in London has launched a campaign to map the areas of London that require improvement for cycling. In a recent post I mentioned a similar bit of work being done by the University of NSW.
It is a fantastic tool that uses the power of the internet to get a whole lot of information relatively cheeply. Unfortunately it does not make the information available to the general public to see what hazards are being reported by others. They may have done that to avoid people copying other people's posts - they hope to get actual users instead of just web-surfers with time on their hands.
By getting all cyclists to become your auditors of safety it is possible to build up a system to prioritise issues in the network. The system will prioritise safety or maintenance issues that affect the most people. Unfortunately it may not prioritise issues that have the most risk due to the fact that most cyclists are risk-averse and will therefore not use routes that are very risky.
It is a fantastic tool that uses the power of the internet to get a whole lot of information relatively cheeply. Unfortunately it does not make the information available to the general public to see what hazards are being reported by others. They may have done that to avoid people copying other people's posts - they hope to get actual users instead of just web-surfers with time on their hands.
By getting all cyclists to become your auditors of safety it is possible to build up a system to prioritise issues in the network. The system will prioritise safety or maintenance issues that affect the most people. Unfortunately it may not prioritise issues that have the most risk due to the fact that most cyclists are risk-averse and will therefore not use routes that are very risky.
Friday, August 19, 2011
Audit of Victorian Cycling Strategy
The Auditor General of Victoria has released a report on the 2009 Victorian Cycling Strategy. The report recognises the importance of the strategy for raising the profile and supporting cycling. Far from condemning the Strategy it is very supportive of it and recommends greater effort, not reduced effort to promote cycling as the news reports appear to imply. It does however raise some issues that are worth taking note of. In the words of the Auditor General:
I hesitate to comment on the AG's report or the Cycling Strategy as I have not studied the AG report and am not familiar with the rollout of the Cycling Strategy, but three things stand out for me:
The strategy was developed in haste without sufficient understanding of either current cycling journeys or what was required to ‘mainstream’ cycling as a form of transport. There was an overemphasis on physical infrastructure solutions, to the relative neglect of other measures essential to achieving the strategy’s goal, such as promoting cycling, educating potential cyclists and reducing the incentives to use cars.
In addition, agencies were not well prepared to implement the strategy or evaluate its success, and this contributed to the unsatisfactory progress in addressing its limitations.I hesitate to comment on the AG's report or the Cycling Strategy as I have not studied the AG report and am not familiar with the rollout of the Cycling Strategy, but three things stand out for me:
- insufficient understanding of current cycling journeys - we have an excellent understanding and many data and analysis resources for understanding existing and predicting future vehicle trips. We are developing a similar capability for public transport. Cycling and walking are lagging behind significantly.
- reducing incentives to use cars - a political hot potato but probably one of the most powerful tools in behaviour change. TransLink recently released their passenger survey. The main reason for drivers taking public transport was that it was too expensive to park at work or that public transport was the cheapest option.
- not well prepared to ... evaluate its success - this is partly related to the first point. Without sufficient base-line data it is impossible to understand success.
Monday, July 18, 2011
Bike Bulletin
The New South Wales government's NSW BikePlan can be found here along with the reports from several interesting research projects including the cost and benefit of cycling related investments, barriers to cycling in NSW, bicycle parking at rail stations, and an analysis of the available data related to cycling.
To keep the public up-to-date with the delivery of the plan they are publishing the Bike Bulletin. This report on how they are delivering the plan. It would be great if the Bulletin also gave some information on usage of these facilities before and after the investment.
Saturday, December 11, 2010
Worlds most cycle-able cities
Found this blog post listing the 15 most cycle-able cities in the world on the Matador Network. They were not ranked, just listed as the best for their area. It was more a list of European and North American cities than a true world listing, but still interesting.
Europe
Amsterdam
Barcelona
Berlin
Copenhagen
Paris
North America
Boulder
Chicago
Davis
Ottawa
Portland
San Francisco
Elsewhere
Beijing
Cape Town
Bogota
Perth
It would appear to just be the opinion of the blogger, not a true scientific study, but it is interesting to note that Perth wins the title as the most cycle-able city. This is surprising as it is not the best performer when it comes to mode share for the journey to work (data from the Cycling Resource Centre).
The 2006 census shows Perth coming in with the 3rd worst mode share for cyclists to work (same mode share as Brisbane) and lagging far behind Canberra and Darwin. Does that make Darwin and Canberra the most cycle-able cities? Or is it just that they are the cities with the worst public transport and parking issues?
Europe
Amsterdam
Barcelona
Berlin
Copenhagen
Paris
North America
Boulder
Chicago
Davis
Ottawa
Portland
San Francisco
Elsewhere
Beijing
Cape Town
Bogota
Perth
It would appear to just be the opinion of the blogger, not a true scientific study, but it is interesting to note that Perth wins the title as the most cycle-able city. This is surprising as it is not the best performer when it comes to mode share for the journey to work (data from the Cycling Resource Centre).
Saturday, October 23, 2010
London cycle hire
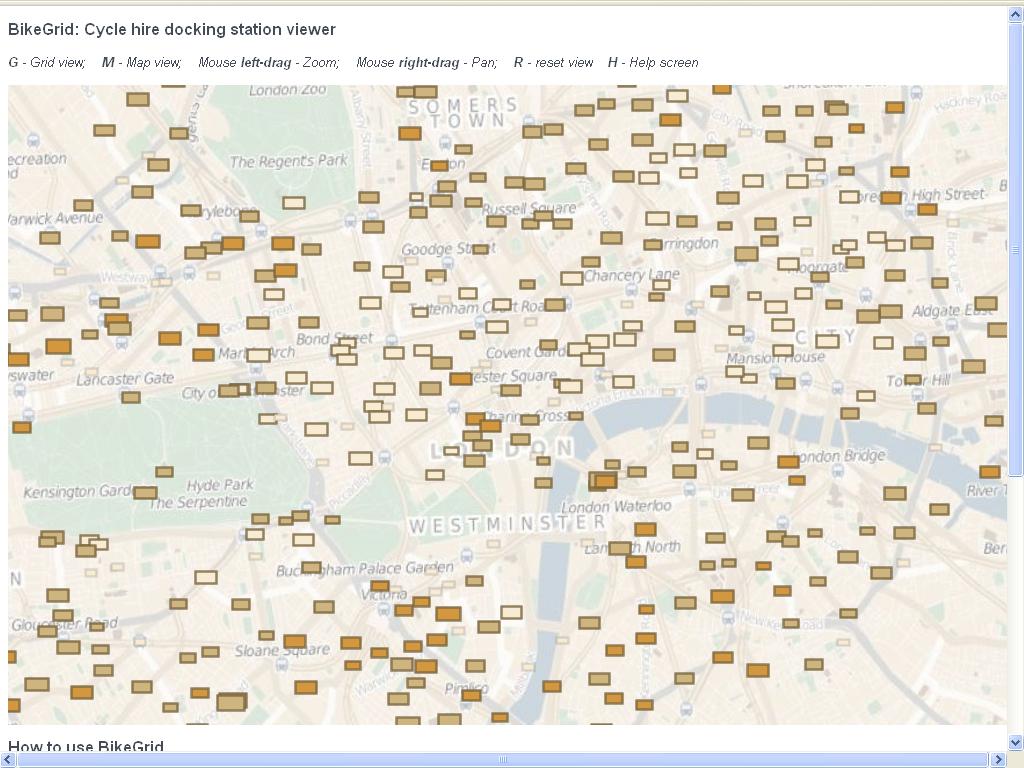
London's bike hire scheme - Barclays bike hire - have a website that gives real-time information on the availability of bikes/spaces at the different stations all across London. The first thing that struck me was the number of hire stations and bicycles scattered around central London. Quite incredible.It is a little difficult to use at first but once you get the hang of it, it provides interesting information on the use of the scheme. If you go to the grid view - press G and the map morphs into a grid - you can zoom into each station and see what the use has been over the last 24 hours and how many bikes are there right now.
Brisbane's CityCycle scheme and Melbourne's Bike share scheme have real time maps (CityCycle map here, Melbourne map here) where you can get information on the number of bicycles or spaces available at any station. They don't give a history of use though so it is impossible to see a history of usage.
Interestingly the information in the CityCycle web site has a field 'credit cards accepted'. All the stations currently indicate that no credit cards are accepted, but this possibly points to this being a feature that can be added.
Subscribe to:
Posts (Atom)